A Basic ROI calculation
The input form
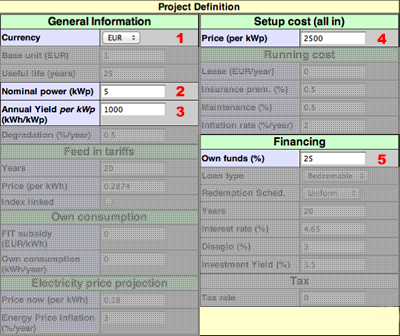
The input form looks daunting at first. Let's focus on the most important fields first. Below you see the "Project Definition" form with most sections grayed out.

- Currency: Enter the currency of your choice.
- Nominal power (kWp):Enter the nominal power in kWp. For example if you plan on installing 5 panels with a rated power of 200Wp each, you enter 1kWp here. Stick to the default if you just want to follow the example. See the glossary entry what is kilowatt-peak?.
- Annual yield per kWp (kWh/kWp): The annual yield depends on the annual irradiation at your location, the geometry and efficiency of the installation, and other factors. Your installer should be able to give you a precise number. For a rough estimate you can use tools like the PVGIS Estimation Utility (Europe) or PVWatts by the NREL (USA). See the "Links" page under Resources->Links.
- Price (per kWp): Enter the price per kWp you are paying for the installation. This is the all-in cost, i.e. it should include labour costs etc. Stick to the default if you just want to follow the example.
- Own funds (%): To keep things simple for now assume that you do not borrow money to finance the installation. You use 100% own funds, so enter 100 here.
Now click 
The Project Summary table
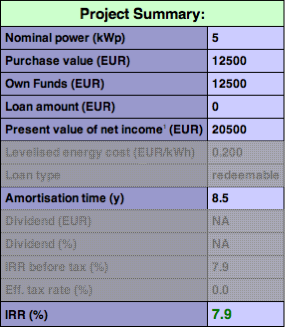
In the results section you find the results of the calculation. The first table is entitled "Project Summary". It contains the key information about the finances of you project.

- Nominal power is the nominal rated power (in kWp) of your installation.
- Purchase value is the amount the whole project cost.
- Own funds is what you paid out of your own pocket. Since we entered 100% own funds above, you bear 100% of the project cost.
- Present value of net income: At the core of the calculation is the cash flow projection for the life of your installation. i.e. the projected income statement. By discounting the net income cash flows you obtain the present value of your installation.
- Amortisation time is the time (in years) it takes until you recouped your investment.
- IRR stands for "internal rate of return". In this context this number is sometimes also called ROI (return on investment). The IRR allows you to compare the return with that of other investments that have predictable cash flows, such as bonds or CDs. (More on this in the section IRR.)
The Cash Flows Table
The cash flow table gives a detailed estimate of the annual cash flows. The first row shows the energy produced in a year, resulting in the gross income for that year. The following rows break down the costs:
- Lease
- Insurance
- Maintenance
- Interest
The resulting profit are called earnings before provisions ("EBP"). This term is somewhat unusual and what it means is this: Depending on the loan type money has to be put aside in order to pay back the notional amount of the loan at maturity, or redeem the loan according to the redemption schedule. The rows below "EBP" show these provisions, depending on the loan type chosen in the input form.
After subtracting the provision we obtain the Income before Tax.
In order to calculate the tax we first have to deduct the depreciation amount to arrive at the Taxable Income from which the Tax is deducted.
The bottom line is the Net Income after Tax The net income provides cash flows numbers that are used in calculating the IRR (internal rate of return) and the other results in the project summary table.
Interpreting the Graphs
Graph 1 is simply a pie chart that shows how the gross income is split up. The green slice is the "bottom line", i.e. the net income after tax. The other slices show the four cost factors.
Graph 2 shows the projected net income for the useful life of the installation (as defined in the input form). The net income is the sum of net income after tax (green) and the paid tax (brown).
Graph 3 shows the breakdown of the gross income. The gross income is composed of
- Income before tax
- Interest
- Redemption
- Other (i.e. the sum of lease, insurance and maintenance costs)