PV Price Forecast
Overview
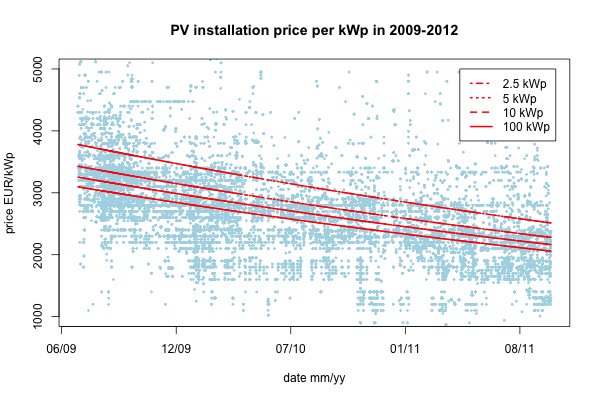
We analyzed the total costs of solar PV installations based on the anonymized data collected by the online investment ROI calculator PVCalc.
The data spans the period July 2009 - Dec. 2011 and contains price and nominal power data. A simple plot already reveals falling PV installation prices. A closer look also reveals a dependency on the nominal (kWp) power specification.
Forecast
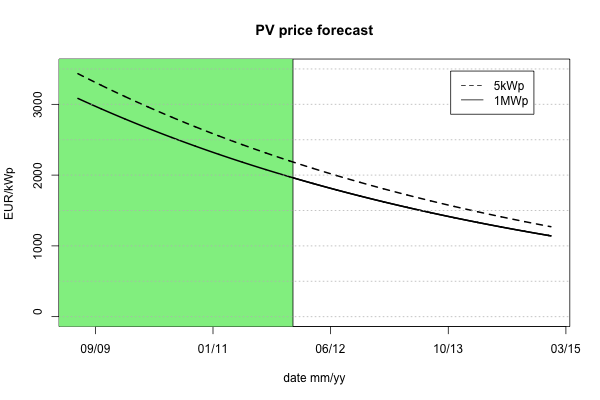
The green shaded area in the graph below identifies the past period on which the estimation is based. To the right of the shaded area is the forecast period.
The solid line shows the installation cost per kWp for an 1MWp installation, and the dashed line shows the same for a small 5kWp installation. One result of the regression is that the cost halves every four years.
Note that the fitted prices and forecast are average prices. The data shows, that prices can vary up to 30% on the up- and downside.
Grid parity
Let's attempt an estimate of when grid parity will be reached. I use the following assumptions:
- 1400kWh/kWp annual yield,
- whole sale energy price of 50EUR/MWh, with 3% annual price inflation, and
- financing with 50% own funds, 3% interest rate
which give grid parity at an all-in cost of around 1000EUR/kWp. Grid parity is defined as the point where energy production is possible at a ROI of 7%.
The average price per kWp for a large installation in Jan. 2012 is 2000EUR/kWp. The best achievable price is around 1500EUR/kWp. This cost needs to fall by 33% in order to achieve grid parity. According to the regression result this point will be reached in 2.3 years from 1/1/2012, i.e. in April 2014.
Remark: For this forecast to hold the cost decay will have to continue at the pace observed in the last 2-3 years.
Parameter fit
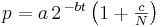
The following assumptions are made when modelling the price (p) decay with time (t) and the dependence on nominal power (N):
- The price decay is exponential
- The price per kWp is inversely proportional to the nominal power
I.e. the following equation is fitted to the data:
The resulting best fit is:
| Parameter | Value | Std.error |
|---|---|---|
| a | 3370 | 8.7 |
| b | 0.26 | 0.0023 |
| c | 0.57 | 0.0097 |
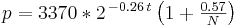
(Time t is years since 1/1/2009 and nominal power N is measured in kWp).